The Challenge
NielsenIQ is one of the world’s largest consumer intelligence companies, providing retail and consumer data to brands and retailers globally. Their Discover platform — the primary tool analysts use to access market performance data, trend analysis, and competitive insights — needed a comprehensive redesign. The existing experience had grown fragmented as features were added over time, with inconsistent UI patterns, no unified design system, and an information architecture that didn’t match how analysts actually worked.
The platform had to serve power users running complex multi-dimensional queries across product categories, geographies, and time periods — while also being approachable enough for less technical stakeholders who needed quick answers from the data.
Approach
I was brought on as a contract design lead, one of several leads working across NielsenIQ’s LeSS (Large-Scale Scrum) agile environment, where multiple teams shipped features in parallel against the same product surface. My primary ownership was the design system — the foundational layer that kept the product visually and structurally coherent as different teams built on top of it. Beyond the system, I contributed to the product IA, dashboard UI, guided user flows, login experience, and illustration work.
Coordinating with other design leads across workstreams was a constant discipline. With parallel teams shipping simultaneously, maintaining consistency required a shared language for design decisions and regular alignment on how components were being used and extended. The design system was the connective tissue that made this possible.
To give leadership visibility into how all the pieces fit together across workstreams, I produced an end-to-end experience video that walked through the full user journey — showing how the design system, IA, guided flows, and individual screens connected into a unified product story. This became a key communication tool for stakeholders who couldn’t see the forest for the sprint-level trees.
The first priority was understanding the product’s complexity. NielsenIQ Discover isn’t a simple dashboard — it’s a multi-layered analytics platform where users construct reports across dimensions like brand, category, geography, retailer, and time period. I mapped the entire product information architecture to understand the structure before redesigning any surface.
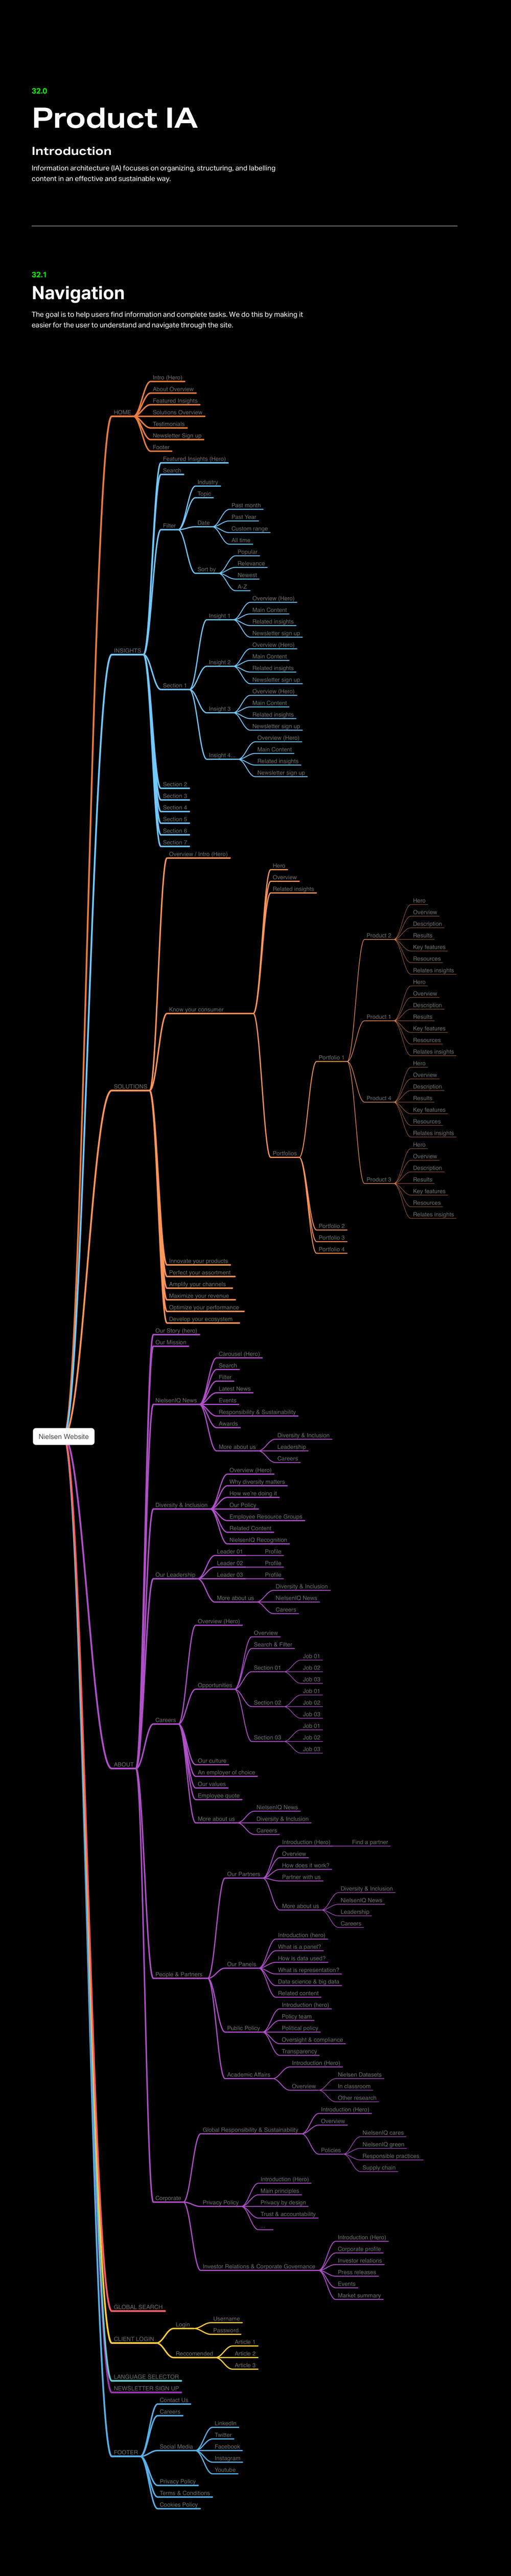
That IA map became the foundation for every design decision that followed. It revealed redundancies, dead ends, and places where the navigation structure didn’t match the user’s mental model of how retail data analysis works.
Design System
I built the design system from the ground up, establishing foundational rules that would scale across the entire platform. The system was built on a 4px increment grid — all padding, spacing, and sizing snaps to multiples of 4px (with rare 2px exceptions for optical balance at smaller breakpoints). This created mathematical consistency across every component without requiring designers to eyeball spacing.
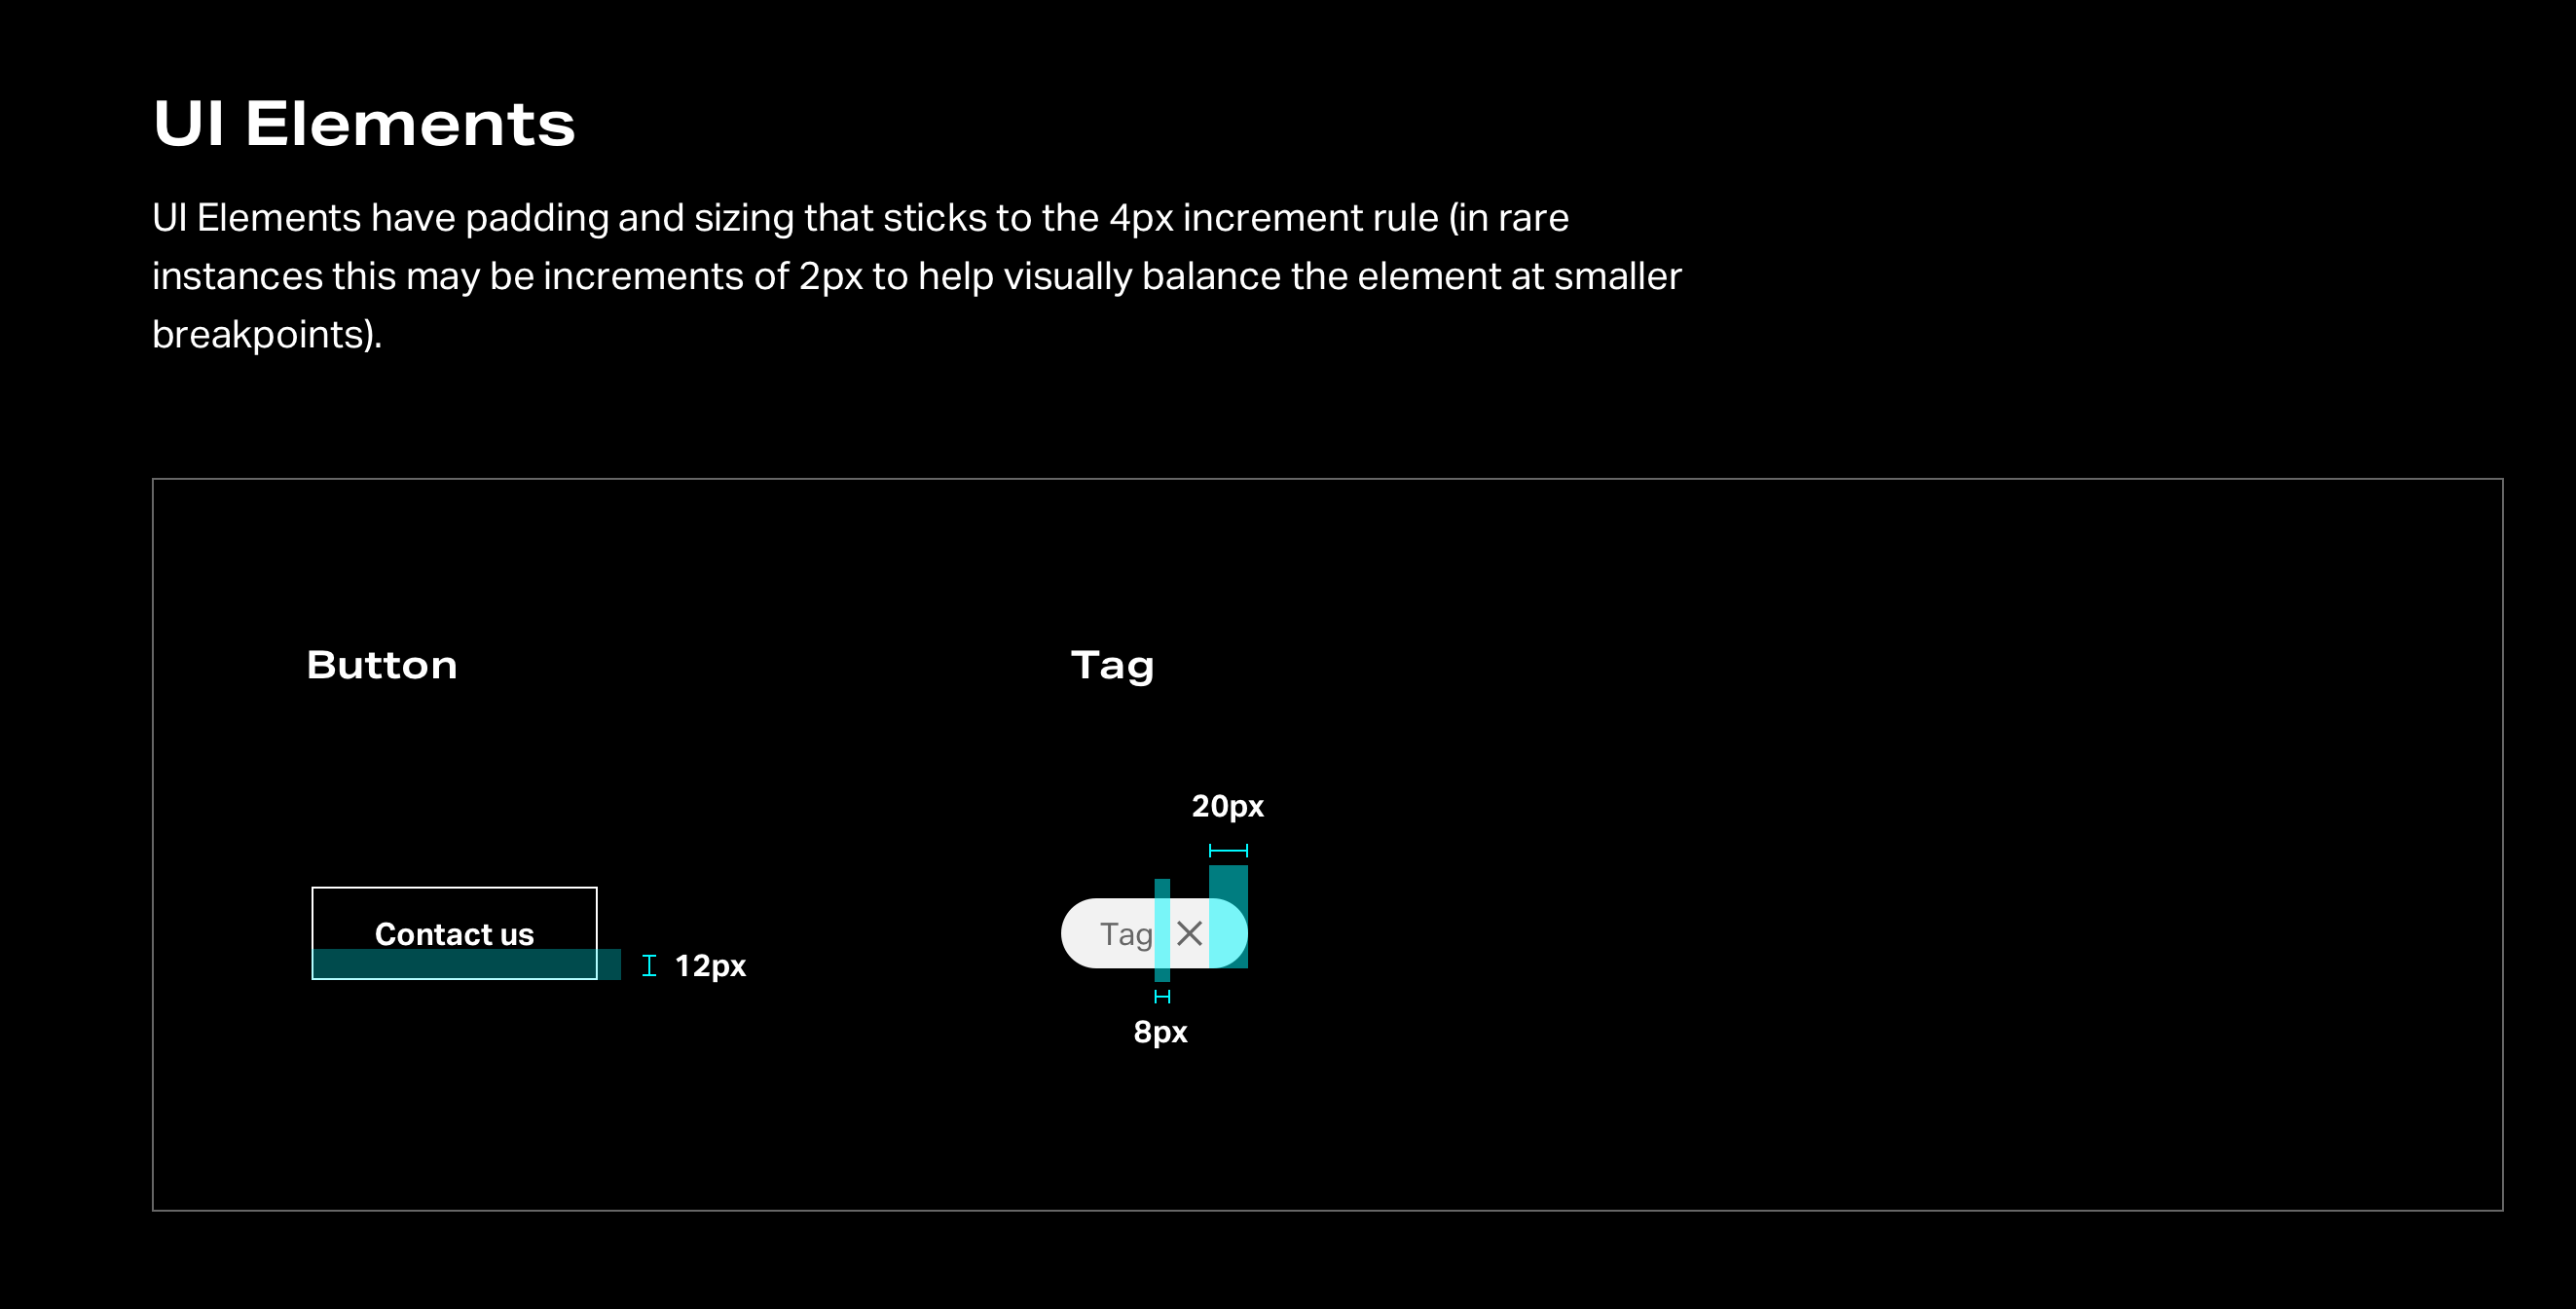
Components were designed to be composable — buttons, tags, form elements, data visualization primitives — each documented with spacing specs, interaction states, and usage guidelines. The system had to support dense data interfaces without feeling cramped, which meant every pixel of padding was a deliberate decision.
Guided Flows & Product UI
The core product work centered on how analysts navigate through complex report-building workflows. I mapped and designed guided flows for the platform’s key tasks — omni-channel reporting, brand shifting analysis, retail shifting, shopper performance, and geographic deep dives.

Each flow had to balance flexibility with guidance. Power users needed to construct custom queries with granular control, while less experienced users needed a path that led them to meaningful insights without requiring expertise in every parameter. The solution used progressive disclosure — start with high-level choices, then expose complexity as the user narrows their focus.
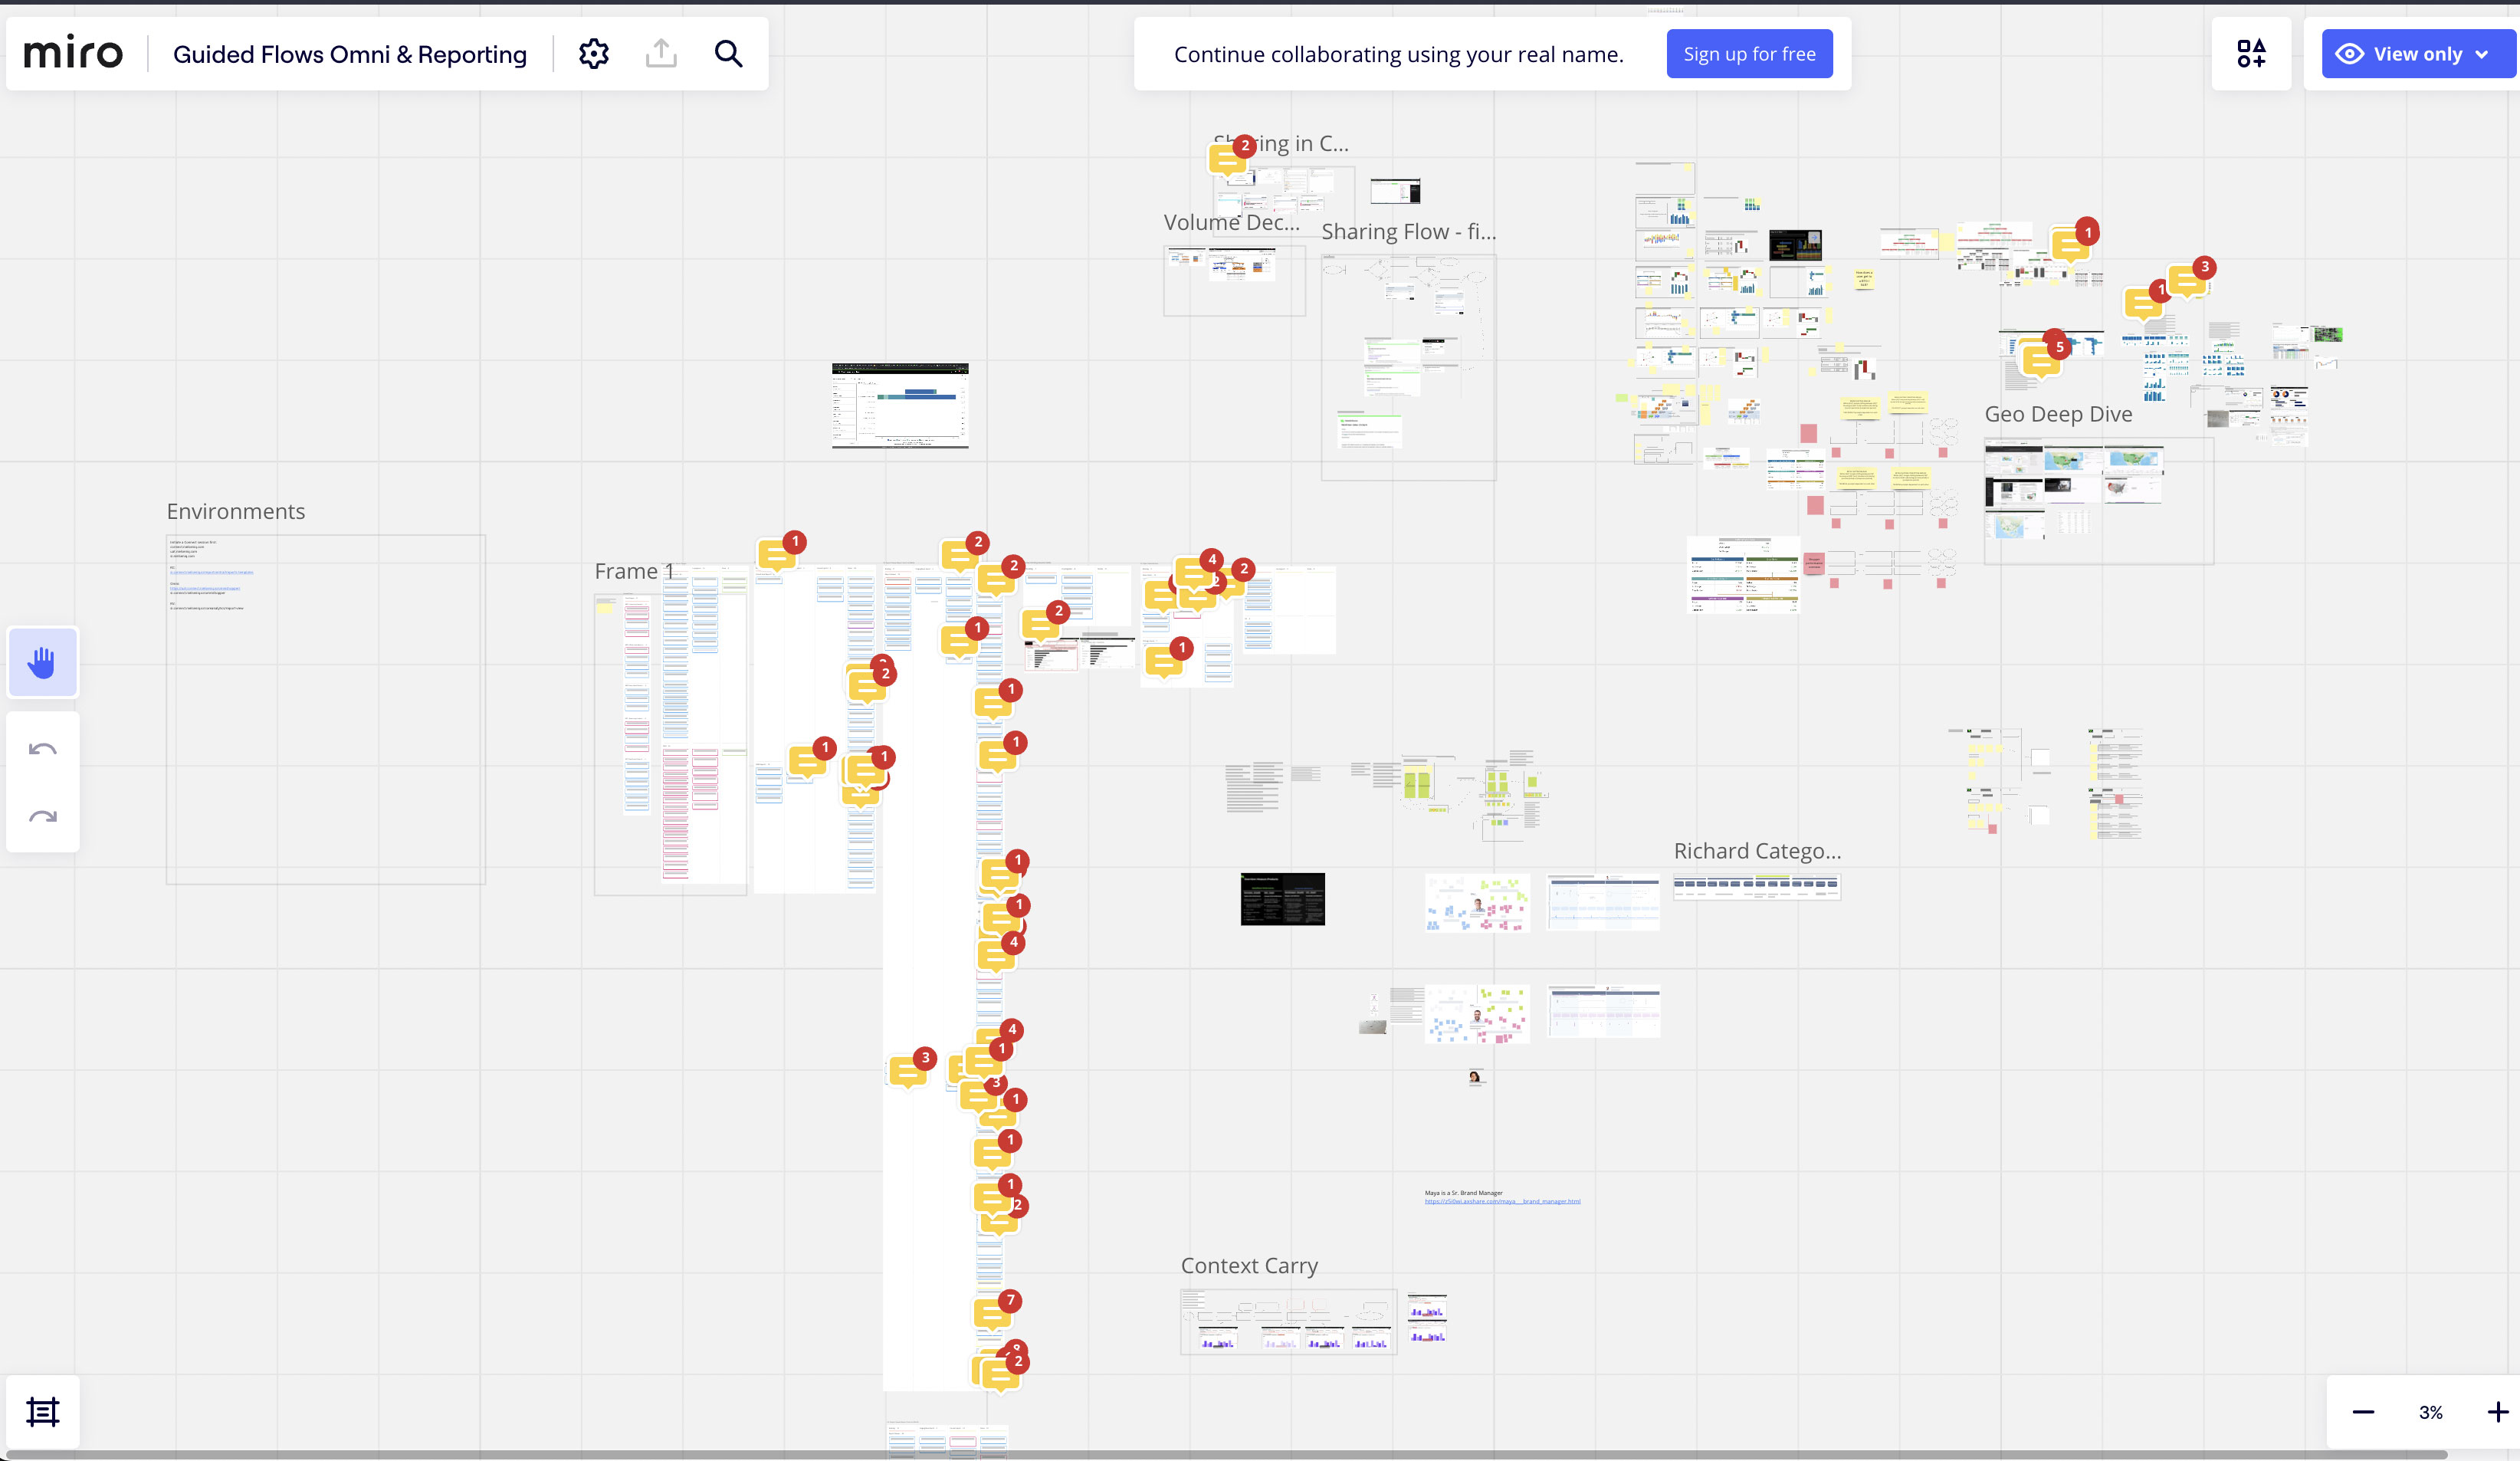
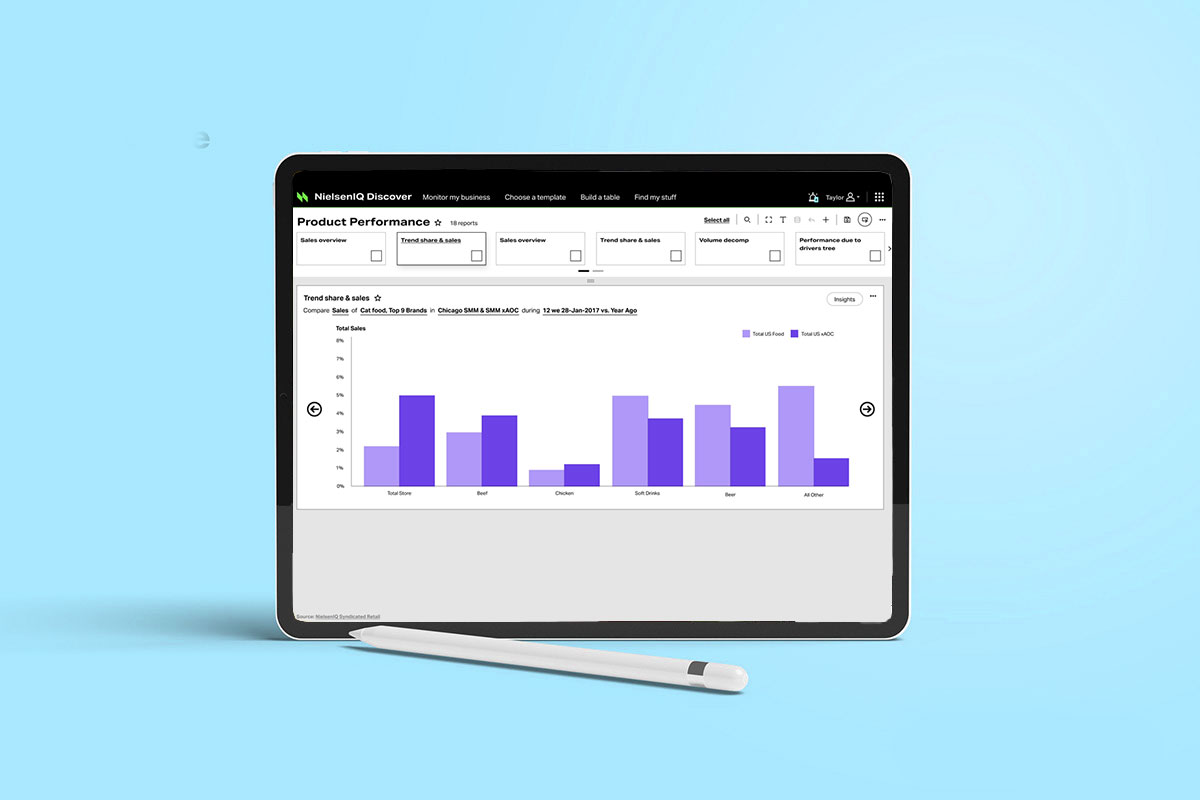
The resulting dashboard UI surfaced data through a tab-based report structure — Sales Overview, Trend Share & Sales, Volume Decomposition, Performance Drivers — letting users move between analytical perspectives without losing context. The “Context Carry” pattern I designed ensured that filters and selections persisted as users moved between views, eliminating the frustration of re-entering parameters.
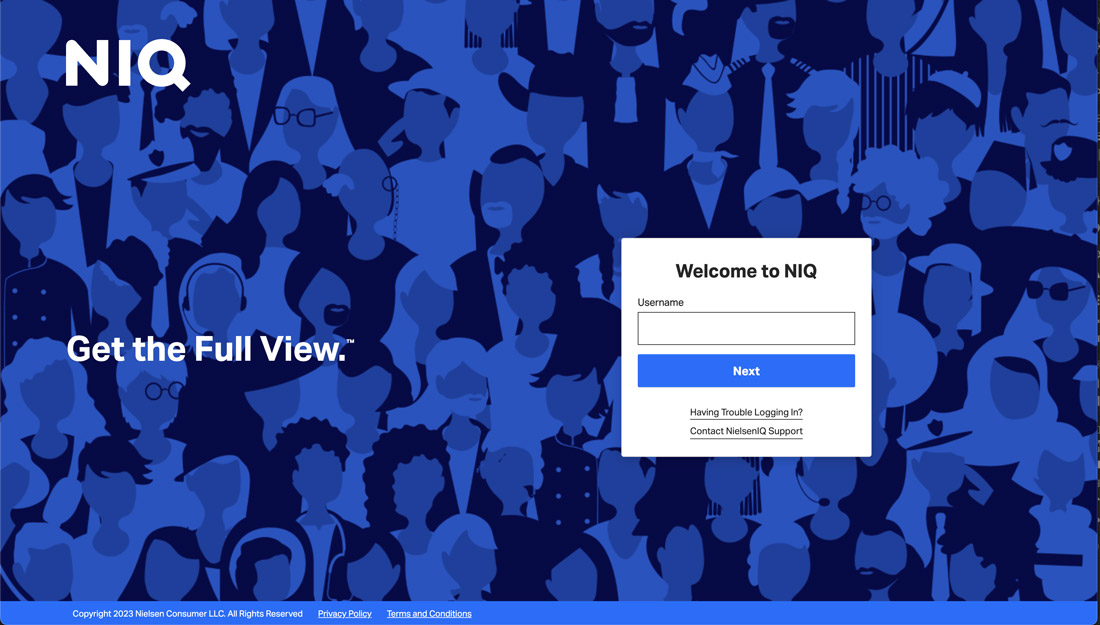
Login & Brand Touch
The login screen was the user’s first encounter with the platform — and an opportunity to inject brand personality into what’s typically a throwaway screen. I designed the illustrated crowd pattern that fills the background, representing NIQ’s tagline “Get the Full View” through a diverse, stylized population. The illustration was a deliberate contrast to the data-dense product behind it — a moment of warmth before the analytical work begins.
Results
The redesigned platform shipped as NielsenIQ Discover, serving as the primary analytics tool for NIQ’s global client base. The design system established consistent patterns across the product surface, reducing design debt and accelerating feature development. The guided flow work gave the product team a framework for onboarding new analytical modules without reinventing the interaction model each time.